High-level analysis in FSL aggregates results from individual subjects to draw inferences about a population. The typical steps involve:
- Data collection: Gather first-level FEAT outputs (cope, varcope, and sometimes t-statistic images).
- Design specification: Define your design matrix and contrast vectors to model group-level effects.
- Estimation: Use FSL’s FEAT (or FLAME) for mixed-effects analysis.
- Inference: Correct for multiple comparisons and interpret cluster or voxel-level results.
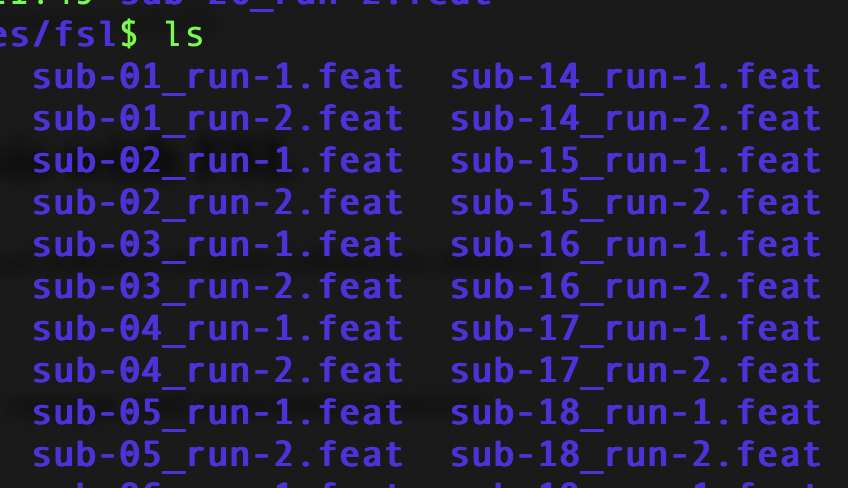
1. Prepare your first-level data
After the first-level analysis, you have the necessary data organized. For example, you put all subject-wise data in subfolder derivatives:
2. Create Design and Contrast Matrix
Open Feat & GUI, and add all first-level feat folders or COPE files, depending on your experimental design.
Andy Jahn’s brain book website provides excellent instructions on this. Please check his second-level analysis and third-level analysis for details.
Essentially, you need to create a higher-level analysis by setting up a new FEAT design file. Here is an example of such design file:
# Higher-level FEAT design example for one-sample t-test

# Set the basic parameters
set fmri(npts) 1
set fmri(outputdir) "group_level.feat"

# Input subject-level cope images
set feat_files(1) "/path/to/sub01/first_level.feat/stats/cope1.nii.gz"
set feat_files(2) "/path/to/sub02/first_level.feat/stats/cope1.nii.gz"
set feat_files(3) "/path/to/sub03/first_level.feat/stats/cope1.nii.gz"
# ... add more subjects as needed

# Define the design matrix file paths
set fmri(groupfile) "feat_dir_list.txt"
set fmri(cope1) 1

# Set up the design for a one-sample t-test
set fmri(contrasts) "1"
set fmri(contrast_names1) "Mean Effect"

# Use FLAME stage 1 (or stage 1+2 for more accurate variance estimation)
set fmri(flame_level) 2
The above example uses the FLAME method (FMRIB’s Local Analysis of Mixed Effects).
3. Inspecting and Interpreting Results
After running your higher-level analysis, you should review:
- Statistical maps: (e.g., zstat images) to identify significant clusters.
- Cluster reports: Check the clusters in the FEAT report.
- Overlay images: Use FSLview or FSLeyes to overlay significant clusters on anatomical images.